Description
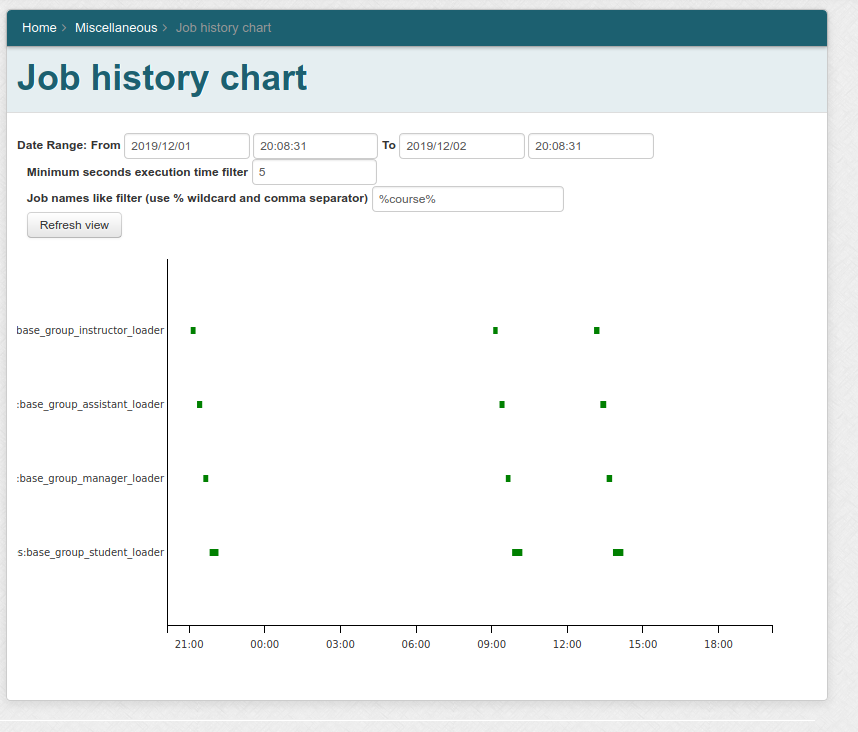
A visual guide to when jobs run is helpful to see how long they run, and whether there is overlap between jobs. For an example of a Gantt chart using the d3 library and under an Apache 2 license, see http://static.mentful.com/gantt-chart-d3v2.js . There could be a filter to include and exclude jobs by type or by loader group path (i.e. partial match). There could also be a date range, so a user could see all the jobs run in a day or a week's time. I envision each horizontal row would be for one job, with a bar covering the time it is running. There could be a color code for successful, failed, running, etc.
![screenshot1[1].png](/secure/attachment/17349/screenshot1%5B1%5D.png)